
Northridge Real Estate Market Update — 2026 Quarter-by-Quarter Outlook

The Northridge 91324 and 91325 real estate market in 2026 is operating in a specific position within the SFV market cycle — a position defined by the partial recovery from the 2022–2023 correction that has pushed the volume tier ($700,000–$950,000) into seller-favorable conditions during peak windows, while the premium tier ($950,000–$1.2M) remains in a more balanced state where buyer leverage is occasionally present and correctly timed strategy produces meaningfully different outcomes than poorly timed strategy.
The three audiences that this market update specifically serves — the buyer evaluating whether now is the right entry point, the seller planning their 2026 listing strategy, and the investor modeling the Northridge BRRRR cycle — each need different intelligence from the same market data. This article provides that intelligence for each: the buyer who needs to understand which quarters offer the best conditions for offer success and negotiating room, the seller who needs the specific launch windows and pricing calibration for each quarter's conditions, and the investor who needs the acquisition price targets, rental market trends, and refinance math that the current Northridge market produces.
1. 📊 Market Foundation — Where Northridge Stands Entering 2026
Understanding the 2026 quarterly outlook requires the baseline market context — where prices are relative to the 5-year trajectory, what the supply and demand picture looks like entering the year, and what the specific demand drivers and constraints define the Northridge market's current position.
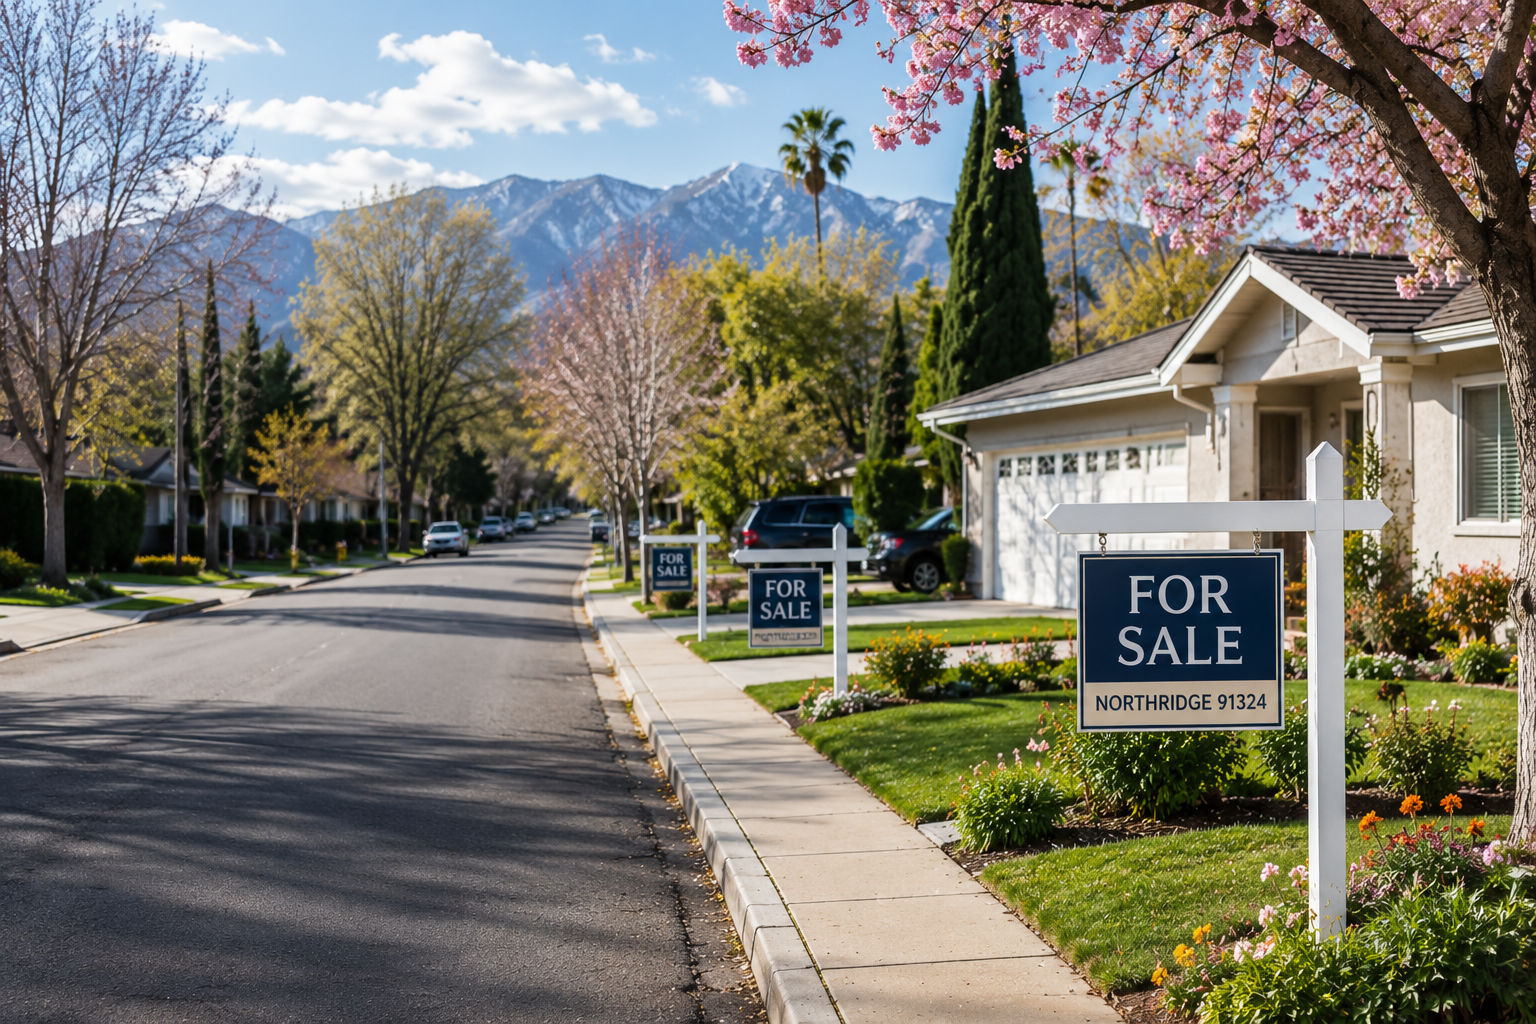 The Northridge 91324 market entering 2026 — the volume tier ($700K–$950K) operating in seller-favorable conditions with DOM of 18–35 days for correctly priced prepared listings during peak windows. The CSUN campus adjacency that creates the investor and rental demand floor, the working-family first-time buyer pool that defines the primary buyer profile, and the FHA financing concentration that makes the market specifically rate-sensitive all characterize the Northridge market position that the 2026 quarterly outlook must specifically serve.
Current price benchmarks (entering 2026):
91324 CSUN-adjacent and core sub-neighborhoods:
- → 💰 Original condition 3-bedroom: $740,000–$820,000
- → 💰 Improved condition 3-bedroom: $820,000–$920,000
- → 💰 Renovated 3-bedroom: $895,000–$1,010,000
- → 💰 Original condition 4-bedroom: $810,000–$905,000
- → 💰 Renovated 4-bedroom: $965,000–$1,095,000
91325 premium sub-neighborhoods (approaching Granada Hills 91344):
- → 💰 Improved condition 3-bedroom: $880,000–$975,000
- → 💰 Renovated 3-bedroom: $970,000–$1,085,000
- → 💰 Renovated 4-bedroom: $1,040,000–$1,175,000
Supply picture:
Active listings entering 2026 are at historically moderate levels for Northridge — not the supply-constrained conditions that drive multiple-offer dynamics in Calabasas and Studio City, but below the inventory levels that would shift the market into buyer-favorable conditions. The current active listing count in 91324/91325 is in the range that supports seller-favorable DOM during spring and fall peak windows for correctly priced listings.
The demand picture:
Three demand drivers characterize Northridge's 2026 market entry:
🎓 CSUN anchor demand: California State University Northridge's 40,000+ student enrollment and 4,000+ faculty and staff creates the most specific and most durable demand anchor in any central SFV market. The CSUN demand produces: (1) the buy-and-hold investor demand for rental properties within walking and short-driving distance of campus; (2) the faculty and staff household that purchases specifically for CSUN commute convenience; and (3) the off-campus student housing demand that sustains the rental income rates that make Northridge investment properties viable at current rates.
🏥 Healthcare employment demand: Northridge Hospital Medical Center 91325 and the broader central Valley healthcare employment cluster (Providence Cedars-Sinai Tarzana Medical Center 91356, West Hills Hospital 91307, and others accessible from 91324/91325) generate consistent demand from healthcare professionals — the nurse, the physician, the healthcare administrator whose income level and employment stability make them reliable owner-occupant buyers at Northridge's volume tier.
📈 Move-up demand from Reseda and Van Nuys: The central Valley move-up buyer — the household that currently rents or owns in Reseda 91335, Van Nuys 91401/91405/91406, or Canoga Park 91304 and is making a residential quality step-up — represents a consistent demand flow into Northridge from adjacent markets at lower price points. This buyer is specifically sensitive to mortgage rate levels because they are frequently stretching to the qualification ceiling.
The rate environment's current impact:
Current conventional 30-year mortgage rates of approximately 7.0%–7.5% have two specific effects on the Northridge market:
- → ⚠️ FHA buyer compression: At 7.25% on a $810,000 FHA purchase (3.5% down, $781,650 loan), the monthly PITI approaches $6,800/month — requiring approximately $232,000–$292,000 in gross household income for comfortable qualification. This income threshold excludes some portion of the entry-tier Northridge buyer pool that was accessible at the 2020–2021 rate environment.
- → ✅ The seller-paid buydown offset: As documented in the Northridge and broader SFV content, the seller-paid 2-1 buydown at $16,000–$18,500 for a $780,000–$900,000 Northridge purchase reduces the year-one effective rate to 5.25% — producing the $900–$1,050/month year-one payment relief that specifically reactivates the payment-hesitant FHA buyer pool that current rates have partially compressed.
2. 📅 Q1 2026 (January–March) — The Slow Build to Spring Peak
Q1 is the most strategically nuanced quarter for Northridge market participants — it contains the worst conditions of the year (January), the transition into building momentum (February), and the opening of the year's primary seller window (mid-to-late March).
January 2026 — The dormant month:
- → 📊 DOM: 55–80+ days for new listings — the longest DOM of any month in 2026
- → 📊 Volume: The lowest transaction volume of the year; most serious buyers who began searching in fall have resolved their purchase or are waiting for spring inventory
- → 📊 Price pressure: Slight buyer leverage — sellers who list in January accept marginally lower prices than comparable spring listings to compensate for the limited buyer pool
- → ✅ For buyers: The best negotiating window of the year. The January seller who is genuinely motivated (estate sale, relocation, divorce) accepts terms in January that the same home wouldn't accept in April. Price concessions of 3–5% below the spring-equivalent price are achievable on correctly identified motivated sellers.
- → ⚠️ For sellers: Avoid January listing unless timeline requires it. The January DOM accumulation that a non-motivated seller experiences establishes a price history that follows the listing into the spring window — triggering the perception of "why has this been on the market since January?" that the serious spring buyer uses as a negotiating tool.
- → ✅ For investors: The January Northridge investor acquisition window is the best of the year — motivated sellers, reduced buyer competition for as-is inventory, and the CSUN academic calendar (spring semester begins in mid-January) reactivates the rental demand that supports investment underwriting.
February 2026 — Momentum building:
- → 📊 DOM: 40–60 days — significant improvement from January as the early-activating buyer pool enters
- → 📊 Buyer pool: The first-time buyer who has been pre-approved since November begins active search in February. Healthcare professional households activate as Q1 income certainty arrives. The Northridge investor who has been watching the Q4 2025 market re-engages.
- → 📊 Price trajectory: Prices begin firming from the January floor. The February listing that is correctly priced may generate 4–7 first-week showings — not the spring peak activity but meaningful engagement.
- → ✅ The February pre-market strategy for sellers: The seller who targets a March 15 spring launch should be in the final weeks of preparation in February — paint drying, flooring installation, curb appeal package completion. The February "coming soon" pre-market period (non-MLS, agent network marketing) can build a first-week showing queue before the MLS launch.
March 15 — The Northridge Spring Peak Opens:
The specific date that the Northridge spring seller window traditionally opens — the combination of CSUN's spring semester in full session, healthcare employer Q1 end, FHA buyer pool fully activated, and the broader SFV spring market momentum that produces the competitive showing traffic and multiple-offer dynamics.
- → 📊 Target DOM from March 15 launch: 18–32 days for correctly priced prepared listings
- → 📊 Multiple offers: Possible on well-prepared renovated volume tier listings priced at the comp ceiling — the spring Northridge market creates competitive dynamics at correctly priced $820,000–$950,000 renovated listings
- → ✅ For sellers: The March 15–April 15 window is the primary launch target for maximum net proceeds in 2026. Sellers who complete preparation by March 1 and launch in the second week of March capture the full spring buyer pool activation.
- → ✅ For buyers: The spring window is competitive but not impossible. FHA buyers with pre-approval in hand, clean contingency structures, and realistic offer prices at or near the comp ceiling win homes in spring. The buyer who lowballs or hesitates on a first-week spring listing consistently loses to a buyer who moves decisively.
3. 📅 Q2 2026 (April–June) — The Primary Window
Q2 is the Northridge seller's best quarter — and the buyer's most competitive quarter. The specific market conditions that Q2 produces require different strategies for each market participant.
April 2026 — Peak conditions:
- → 📊 DOM: 18–28 days for correctly priced renovated volume tier listings — the shortest DOM of the year
- → 📊 Price support: The strongest of the year. Correctly priced spring listings close at or above list price at the highest frequency of any quarter. Multiple offers on well-prepared listings.
- → 📊 FHA buyer concentration: At its annual maximum — the FHA buyer who completed pre-approval preparation in Q1 is most actively searching in April
- → ✅ For sellers: Ceiling pricing in April. The comp ceiling for your specific sub-neighborhood is the correct April launch price — not 5% above hoping for negotiation room. The competitive spring showing traffic produces above-ceiling offers through buyer competition; the spring seller who launches above the ceiling filters buyers at the search-filter stage and misses the multiple-offer dynamic.
- → ✅ For buyers: Move fast on first-week listings that meet the criteria. The April Northridge listing that generates 8–12 first-week showings has 2–4 offers by day 10. The buyer who requests a second showing on a first-week listing before deciding often finds the listing under contract by the time the second showing is scheduled.
May 2026 — Sustained activity:
- → 📊 DOM: 22–38 days — slightly extended from April peak as inventory increases with spring listings
- → 📊 Volume: The highest transaction close volume of the year — the January–March listings that were in escrow are closing; the February–April listings that went under contract are closing
- → ✅ For sellers: Still excellent conditions. The seller who missed the March 15–April 15 peak window can launch in early May and capture most of the spring buyer pool momentum.
- → ✅ For buyers: May offers slightly better conditions than April — more inventory choices reduce the urgency of any single listing. The buyer who is flexible on closing date can sometimes negotiate for a seller credit (seller-paid buydown, closing cost contribution) that April's multiple-offer dynamic didn't allow.
June 2026 — The transition:
- → 📊 DOM: 28–48 days — the spring buyer pool partially exhausted; CSUN semester ends in mid-May and the student-household tenant turnover season begins
- → 📊 Market shift: The entertainment industry buyer (who occasionally crosses over to consider Northridge's value proposition versus their Encino or Sherman Oaks alternatives) begins production season and reduces market activity. The FHA first-time buyer's annual summer slowdown begins.
- → ⚠️ For sellers: The June listing that isn't under contract by June 15 is entering the summer moderation. The seller with a correctly priced listing that generated showings but no offers by mid-June should evaluate whether the pricing needs adjustment before the summer conditions compress activity further.
- → ✅ For investors: June is the CSUN rental market's peak — the turnover season when May–June lease expirations create the rental inventory churn that produces the highest-quality tenant selection opportunities of the year. Investors who closed BRRRR acquisitions in Q4 2025 or Q1 2026 and completed renovations in Q1–Q2 are listing rentals into the peak rental demand period.
4. 📅 Q3 2026 (July–September) — Summer Moderation and CSUN Re-Activation
Q3 is Northridge's most strategically complex quarter — summer conditions reduce the owner-occupant buyer pool significantly, but the CSUN back-to-school period in late August begins re-activating the investor and faculty/staff buyer who produces the fall secondary market.
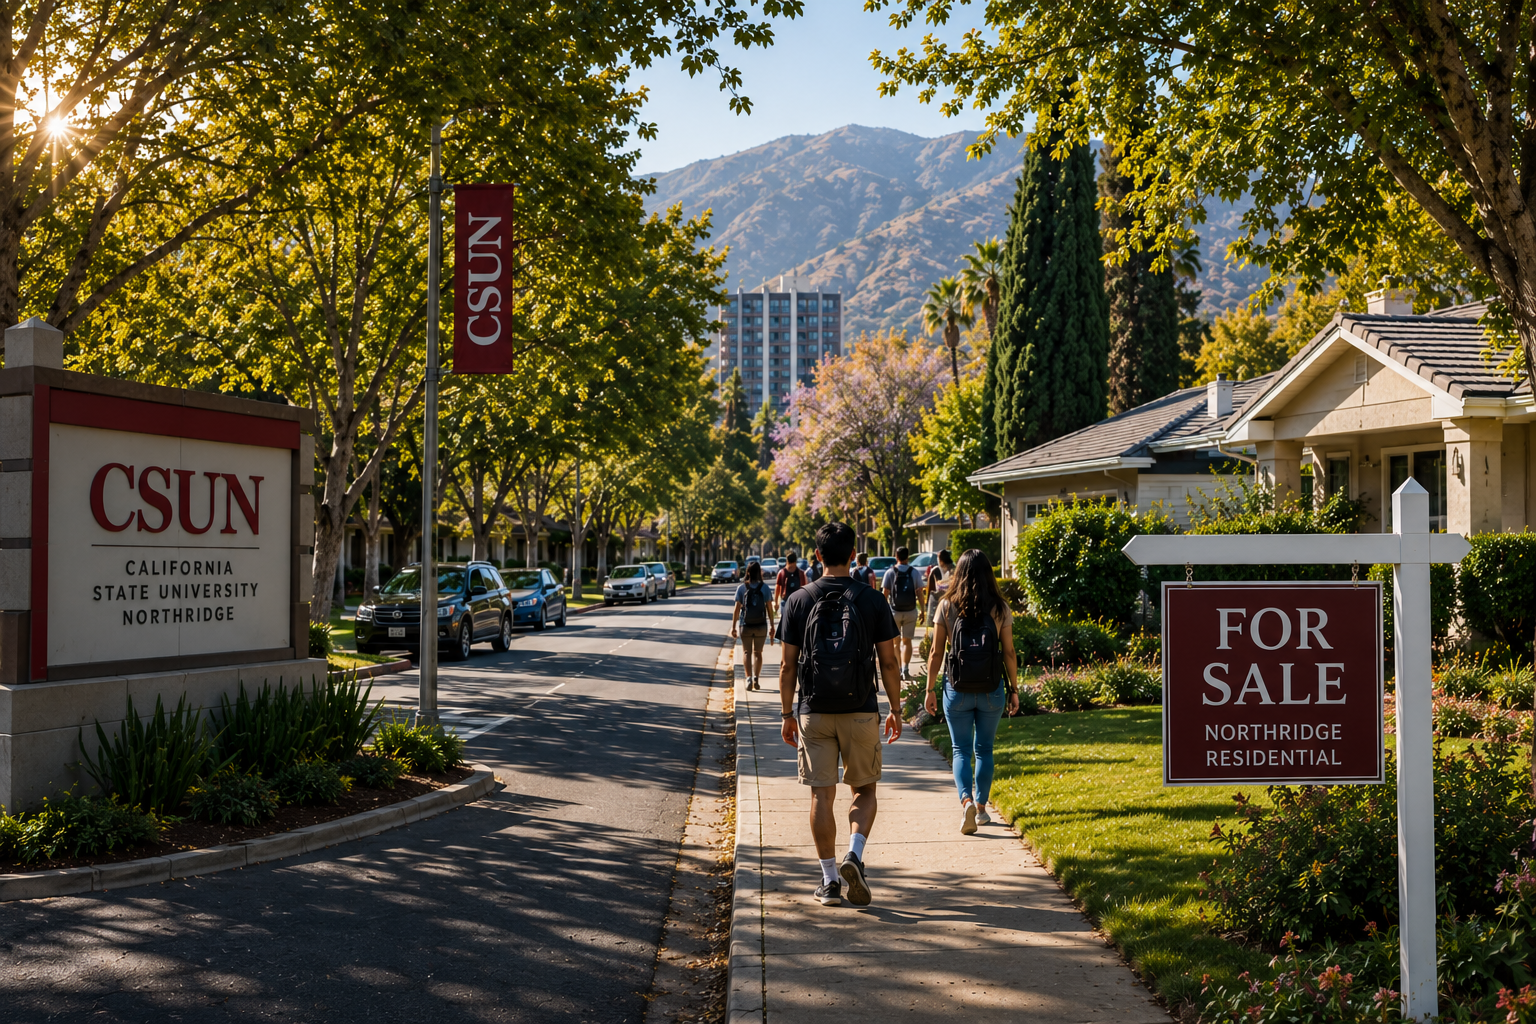 Northridge in the Q3 summer window — the reduced buyer pool that makes the seller-paid buydown the critical activation tool for the payment-sensitive first-time buyer who is still searching but specifically hesitant about the 7.25% note rate payment. The CSUN back-to-school period that begins in late August starts to reactivate the investor and CSUN-affiliated buyer who produces the fall secondary market.
July 2026 — Peak summer moderation:
- → 📊 DOM: 38–58 days — 35–55% above the spring peak DOM
- → 📊 Buyer pool reduction: FHA first-time buyers reduce search frequency as summer schedule demands (school-age children, vacations) create competing time pressures. Entertainment industry buyers are in production. Healthcare professionals in institutional settings take summer leave.
- → 🌡️ Heat factor: Northridge July temperatures regularly reach 95–104°F — afternoon showings specifically suppress buyer comfort. Listing agents should schedule showings before 10:00 AM or after 5:00 PM in July and August.
- → ✅ The summer seller-paid buydown strategy: The Northridge seller who listed in June without a seller-paid buydown and has 25–40 days of DOM should add the buydown at this point. The 2-1 buydown at $16,000–$18,500 reduces year-one effective payment by $900–$1,050/month — specifically reactivating the payment-hesitant FHA buyer who is searching in summer but specifically hesitating on the current-rate payment.
- → ✅ For investors: July BRRRR acquisition window — some correctly priced original-condition Northridge listings accumulate 35–50 days of DOM through the spring-summer transition and become accessible at negotiated prices. The investor who identifies these listings at the correct BRRRR acquisition price threshold can execute acquisitions with more negotiating room than the competitive spring window allows.
August 2026 — The CSUN pre-semester activation:
- → 📊 DOM: 32–52 days — slight improvement from July as the CSUN pre-semester buyer reactivates
- → 🎓 CSUN influence: CSUN's fall semester begins in late August — activating the faculty and staff household who completed the summer interview or hiring process and is now establishing their Northridge residential position before the academic year begins. This specific buyer is not a volume-driver but represents a consistent August Northridge purchase profile.
- → ✅ The rental market parallel: August is the peak of the CSUN rental market — the late-listing tenant who needs housing before semester begins. For BRRRR investors who have a renovated Northridge property available in August, the CSUN rental demand produces the fastest tenant-placement of any month in the calendar year.
September 2026 — Fall activation begins:
- → 📊 DOM: 28–45 days — the beginning of the fall recovery that the October secondary window produces
- → 📊 Re-engaged buyer pool: The buyer who missed the spring window, whose lease ends in September/October, and who is motivated to close before the school year is fully in session. This buyer is often more motivated than the spring buyer who had more time flexibility.
- → ✅ For sellers: September is when the summer listing that has accumulated 60+ days of DOM should make the pricing correction that positions it for the October re-engagement window. The reduction to the correct comp ceiling in September re-positions the listing as a fall fresh start; the reduction in November is too late to capture fall momentum.
5. 📅 Q4 2026 (October–December) — The Fall Window and Winter Dormancy
Q4 contains Northridge's second-best seller window (October through November 10) and its worst month (December) — the strategic challenge is capturing the fall window before it closes and managing the holiday dormancy that follows.
October 2026 — The secondary peak:
- → 📊 DOM: 22–38 days for correctly priced listings — approaching spring peak conditions in inventory-constrained falls
- → 📊 Buyer profile: The re-engaged buyer (missed spring, lease-end motivated), the year-end financial event buyer (the professional who received a year-end bonus and has the down payment now), and the investor positioning for Q1 2027 CSUN acquisition who is actively evaluating properties.
- → ✅ For sellers: The October 1–November 10 window is the best fall opportunity. Correctly priced listings in this window generate 6–10 first-week showings and offers within 15–25 days. The seller who targets an October launch should complete preparation by mid-September.
- → ✅ For buyers: October is the best buyer opportunity outside of summer for finding motivated sellers. Listings that have been on market since August or September without a price correction are accumulating seller motivation — the patient October buyer who identifies correctly priced extended-DOM listings (not the overpriced listings that have accumulated DOM due to pricing errors but have finally reduced to the correct level) has genuine leverage.
November 10 — The cutoff:
The Northridge fall window closes sharply at approximately November 10 — when holiday season attention begins competing with home search focus and buyer pool depth drops meaningfully. A November 1 listing launch has 9 days of fall momentum; a November 15 launch enters the holiday pre-dormancy period.
November 11–30 — The transition:
- → 📊 DOM: 45–70 days — the window has closed but not fully dormant
- → ⚠️ For sellers: A November 11+ launch is not prohibited but requires realistic expectations — the listing that doesn't go under contract before Thanksgiving will carry into December and be perceived by spring buyers as a stale listing unless withdrawn and re-launched.
December 2026 — Dormancy:
- → 📊 DOM: 60–90+ days for new listings
- → ✅ Strategic withdrawal: Sellers who have been on market since August–September without success should seriously consider withdrawing in December and re-launching in the March 15 spring window with refreshed positioning, updated photography, and potentially a more competitive price. The December accumulation of DOM costs the seller the "new listing" energy that the spring re-launch produces.
- → ✅ For buyers: The best buyer leverage of the year outside of January. December motivated sellers (estate sales, relocation deadlines, divorce proceedings) accept terms and prices that any other month wouldn't produce. The patient buyer with flexibility on timing should specifically identify December Northridge listings that are genuine motivated-seller situations.
- → ✅ For investors: December BRRRR acquisition target month — the annual maximum for negotiating power on original-condition Northridge inventory. Combined with the January activation of CSUN spring semester rental demand, a December acquisition positions the investor for the fastest possible renovation-to-rental cycle.
🚫 What NOT to Overdo
Don't list in Q1 unless the timeline specifically requires it. The January Northridge listing that is not motivated by a genuine timeline constraint (probate deadline, relocation start date, lease end) is accepting $30,000–$60,000 less in net proceeds than the same preparation launched in the March 15–April 15 spring window would produce. The seller who has flexibility should wait for the spring peak even if that means 6–10 additional weeks of carrying cost — the net proceeds improvement from spring peak pricing consistently exceeds the carrying cost of the wait.
Don't underestimate the summer buydown's activation power for the payment-sensitive FHA buyer. The summer Northridge listing that is correctly priced but generating stalled showing traffic frequently has one specific problem: the first-time FHA buyer is interested but specifically hesitating on the 7.25% rate payment. The seller-paid 2-1 buydown added at day 30–35 of summer DOM consistently produces the showing resurgence that reactivates this buyer. The $16,000–$18,500 buydown cost that the summer stalled seller adds produces the offer that would have been written in spring if the buydown had been in the listing from launch. Consider including the buydown in any Q3 listing launch rather than waiting for it to become necessary.
Don't ignore the CSUN academic calendar as a market timing input. The CSUN semester calendar — fall semester beginning in late August, spring semester beginning in mid-January — produces specific demand patterns that most non-Northridge-specific market analysis misses. The August CSUN pre-semester faculty/staff buyer, the January CSUN spring semester investor who acquires for the incoming student rental market, and the May–June CSUN rental turnover season that validates BRRRR investor rental projections are all Northridge-specific market signals that the CSUN-adjacent market observer should incorporate into timing decisions.
Don't apply premium market DOM benchmarks to Northridge volume tier analysis. The 60–90 day DOM that the Calabasas premium tier routinely produces for correctly priced $2.0M+ listings is not a sign of market distress in Calabasas — it reflects the thin buyer pool at the premium tier. The 60–90 day DOM that a Northridge 91324 volume tier listing produces at $820,000–$900,000 is a strong signal that something is wrong — pricing, condition, FHA condition flags, or marketing. At the Northridge volume tier, 60 days of DOM should trigger a specific diagnostic and correction, not a "this is normal for the market" acceptance.
Don't project the 2021–2022 appreciation rate as the forward Northridge baseline. The 23–35% appreciation that Northridge experienced from the 2020 baseline to the 2022 peak was produced by historically anomalous sub-3% mortgage rates and pandemic-driven demand acceleration. The 2026 forward projection of 3.5–4.5% annual appreciation for the Northridge volume tier is the structural demand-supported trajectory — the CSUN anchor, the healthcare employment base, and the central Valley move-up demand that persists through rate cycles. Buyers modeling appreciation for investment underwriting should use 3.5–4.5% rather than the peak-cycle rate.
🏠 Real-World Scenario — Northridge 91324 (Seller)
A Northridge 91324 seller — a 3-bedroom, improved condition (kitchen updated 2021, LVP flooring throughout 2020, primary bath original) — was evaluating their 2026 listing timing. They had a specific relocation timeline: they needed to close by June 30, 2026 to start a new position in another state. They were asking: should they list in January to maximize market time, or wait for the spring peak despite the tighter timeline?
We modeled both paths:
Path 1 — January 15 launch:
- → January DOM average for this condition tier: 55–70 days
- → Expected under contract: approximately March 10–20
- → Expected close: approximately April 15–25 (30-day escrow from contract)
- → Risk: misses the spring peak buyer competition — the multiple-offer dynamic that spring produces at this condition tier
- → Close price projection: approximately $865,000 (January market, reduced competition)
Path 2 — March 15 launch:
- → Spring peak DOM for this condition tier: 22–35 days
- → Expected under contract: approximately April 8–20
- → Expected close: approximately May 12–25 (30-day escrow)
- → Within the June 30 relocation deadline — comfortably
- → Close price projection: approximately $910,000–$925,000 (spring competition)
Net proceeds difference: $910,000–$925,000 (March launch) versus $865,000 (January launch) = $45,000–$60,000 additional net proceeds by waiting 8 weeks for the spring peak.
Carrying costs for the 8 additional weeks of preparation timeline: approximately $7,200 (8 weeks × $900/month ownership costs for a seller with a small remaining mortgage balance).
Net benefit of waiting for spring: $45,000–$60,000 additional close price - $7,200 additional carrying = $37,800–$52,800 net benefit.
The seller waited for the March 15 launch. Spring conditions produced 10 first-week showings and two offers. Accepted at $918,000 on day 18. Closed May 14 — 47 days before the June 30 relocation deadline, with comfortable time to spare.
🏠 Real-World Scenario — Northridge 91325 (Investor)
A BRRRR investor — a dentist based in Granada Hills 91344 with $195,000 in available capital from a prior investment property sale — was evaluating Northridge 91325 as his second BRRRR target. He had missed the 2025 fall acquisition window and was modeling the 2026 opportunity.
His specific question: which 2026 quarter provided the best acquisition opportunity for the Northridge BRRRR, and what were the 2026 rental rate projections for his renovation ROI model?
Q1 January acquisition (his target):
The January Northridge investor acquisition window — the best of the year for negotiating power on original-condition inventory:
- → Target acquisition: $770,000–$810,000 for original-condition 3-bedroom in the 91325 premium sub-neighborhood approaching Granada Hills 91344
- → January acquisition advantage: 3–6% below spring-equivalent pricing on motivated sellers; fewer competing investor bids than Q2–Q3
The BRRRR model at $790,000 acquisition:
- → Down payment (25%): $197,500
- → Renovation scope (focused Northridge specification): $56,000
- → Carrying costs (10 weeks renovation + 4 weeks listing): $12,500
- → All-in position: $866,000
Post-renovation appraised value (91325 renovated comp ceiling): approximately $1,045,000
75% LTV cash-out refinance: $783,750 Capital remaining in deal: $866,000 - $783,750 = $82,250 Capital recycling efficiency: 91% returned; 9% ($82,250) remaining
2026 Northridge 91325 rental market projection:
- → 3-bedroom renovated 91325: $3,600–$3,950/month (above the 91324 average, reflecting the 91325 premium sub-neighborhood and Granada Hills 91344 proximity)
- → Monthly PITI on $783,750 at 7.75% investment rate: $6,430
- → Monthly cash flow without ADU: approximately -$2,480/month
- → Annual appreciation (3.5–4.5% on $1,045,000): $36,575–$47,025
- → Annual principal paydown: approximately $14,200
- → Annual wealth building: approximately $50,775–$61,225
- → Annual cash flow cost: approximately $29,760
- → Net annual return: approximately $21,015–$31,465 on $82,250 remaining equity = 25.5–38.3% annual return
The January 2026 acquisition window produced the acquisition price target of $790,000 (achieved at $782,000 after identifying a motivated estate sale listing on day 22 of January DOM). The renovation was completed by mid-March; the property was rented in late March at $3,780/month to a Northridge Hospital 91325 nurse practitioner household.
The investor who had modeled the Q1 2026 acquisition window — and who executed the acquisition in January when negotiating power was at its annual maximum — achieved a 31% annual return on remaining equity in year one of the hold. The same acquisition attempted in April would have cost $820,000–$840,000 (spring market pricing), reducing the capital recycling efficiency and the annual return.
❓ FAQ
What is the Northridge real estate market like in 2026? The Northridge 91324/91325 market in 2026 is seller-favorable at the volume tier ($700K–$950K) during spring and fall peak windows, with DOM of 18–35 days for correctly priced prepared listings. The premium tier ($950K–$1.2M) is balanced — offers are being accepted but buyer leverage is occasionally present at 35–65 day DOM listings. Price appreciation for the full year is projected at 3.5–4.5% for the volume tier. The FHA buyer concentration (30–40% of transactions) makes the market specifically rate-sensitive; the seller-paid 2-1 buydown is the most effective activation tool for the payment-sensitive first-time buyer who is the market's dominant buyer profile.
What quarter is best to sell a home in Northridge? Q2 (April–May) is the best quarter to sell, with Q1's March 15–April 15 window the most precisely optimal launch window of the year. The spring peak produces the highest showing traffic, most competitive offer conditions, and shortest DOM of the year. For sellers who miss Q2, the October 1–November 10 fall window is the second-best opportunity. December and January are the weakest months — sellers with timeline flexibility should specifically avoid these months.
What quarter is best to buy a home in Northridge? Q3 (July–August) and Q1 (January) offer the best buyer conditions — reduced buyer competition, seller-paid buydowns available as concessions, and motivated sellers whose listings have accumulated summer or winter DOM. For buyers using FHA financing specifically, the summer buydown opportunity (sellers who have been on market 30–45 days and are specifically motivated to add a buydown incentive) is the best combination of price reduction and payment relief available in any quarter.
What are home prices doing in Northridge? Northridge home prices are rising modestly in 2026 — projected annual appreciation of 3.5–4.5% for the volume tier and 2.5–3.5% for the premium tier. The volume tier ($700K–$950K) has fully recovered from the 2022–2023 correction and is testing 2022 peak price levels in the strongest spring conditions. The premium tier ($950K–$1.2M) remains approximately 3–7% below 2022 peak levels. The trajectory is positive but not at the 2020–2022 pace — the structural demand from CSUN, Northridge Hospital, and the central Valley move-up buyer sustains consistent appreciation without the anomalous acceleration that sub-3% rates produced.
Is Northridge a good place to invest in real estate in 2026? Yes — particularly for the BRRRR investor with $180,000–$250,000 in available capital and a 7–10 year hold horizon. The January and Q3 acquisition windows offer the best entry prices. The 91324 CSUN-adjacent sub-neighborhoods produce the most consistent rental demand and BRRRR capital recycling math. ADU addition (garage conversion: $75,000–$115,000) transforms the negative cash flow position from approximately -$3,000/month to approximately -$1,100/month while adding $85,000–$120,000 in appraised value. The Northridge BRRRR with ADU produces approximately 19–28% annual return on remaining equity — among the strongest in the PEP SFV investor coverage area.
Will Northridge home prices go up or down in 2026? Up — modestly and consistently. The structural demand drivers (CSUN anchor, healthcare employment base, central Valley move-up buyer, FHA financing accessibility at the volume tier) sustain the 3.5–4.5% annual appreciation projection for the volume tier. The risk scenario that could produce flat or negative appreciation: a significant mortgage rate increase above 8.0% that further compresses the FHA buyer pool; a CSUN enrollment decline that reduces the rental and investor demand anchor. Neither scenario is the base case for 2026. The base case is continued modest appreciation with the peak spring and fall windows producing the strongest seller conditions and the summer and January windows producing the strongest buyer conditions.
🎯 Bottom Line
The 2026 Northridge market offers specific, quantifiable opportunities for buyers, sellers, and investors who understand the quarterly dynamics — and produces consistent frustration for market participants who apply the wrong seasonal strategy to the wrong quarter.
For sellers: The March 15–April 15 spring launch window is the single most important decision in the 2026 listing strategy. Sellers who prepare for this window — completing the 8–11 week preparation sequence that begins in January — consistently produce $30,000–$60,000 more in net proceeds than the January launch and $20,000–$40,000 more than the June launch. Add the seller-paid buydown to any Q3 summer listing from day one rather than waiting for the activation problem to appear.
For buyers: Summer and January produce the best conditions outside of competitive spring. FHA buyers in particular should specifically plan for the summer window — where the seller-paid buydown is most freely negotiated and where the spring-activated inventory that didn't close provides the patient buyer's best selection. Pre-approval before active search is non-negotiable at Northridge's FHA-dominant buyer pool.
For investors: The January and Q3 acquisition windows are the year's best BRRRR entry points — the motivated seller's maximum negotiating leverage available in the same market where the spring and fall windows produce competitive seller conditions. The CSUN academic calendar is the Northridge-specific timing signal that no generic SFV market analysis provides. Build it into every acquisition and rental model.
At Parkway Estate Properties, Liana's buyer and seller representation across Northridge 91324/91325, Granada Hills 91344, Tarzana 91356, Reseda 91335, and Sherman Oaks 91403/91423, combined with Roman's investment property experience across the central SFV, means every Northridge market conversation is grounded in the sub-neighborhood comp data, the seasonal calibration, and the CSUN-anchor awareness that produces correct decisions for buyers, sellers, and investors in each quarter of 2026.
📩 Want a Personalized 2026 Market Strategy for Your Northridge Situation?
Whether you're planning a spring listing, evaluating a summer buyer entry, or modeling a BRRRR acquisition — we'll give you the specific 2026 market intelligence for your sub-neighborhood, your price tier, and your timeline before you commit to any decision.
Contact Liana Shersher at Parkway Estate Properties: 📧 liana@parkwayestate.com · 📞 (818) 208-5881 · 🌐 parkwayestate.com 15021 Ventura Blvd., Ste. 510, Sherman Oaks, CA 91403
About the Authors
Liana Shersher is a licensed real estate agent with Parkway Estate Properties Inc. and an Accredited Buyer's Representative (ABR) serving the San Fernando Valley — with a focus on Sherman Oaks, Encino, Tarzana, Woodland Hills, and Northridge (DRE# 02164224). Liana guides first-time homebuyers through every step of the purchase, from the first showing to the keys in hand, and represents move-up and repeat buyers across the Valley. For sellers, she builds the pricing and marketing strategy that positions a home to sell for top dollar, fast. Buyers and sellers work with Liana for clear communication, sharp local knowledge, and an agent who treats their goals like her own.
Roman Shersher is the broker-owner of Parkway Estate Properties Inc. and a real estate investor with 18 years of experience in the San Fernando Valley (DRE# 01855095). Roman has personally led or co-led renovations on dozens of properties across the Valley, including recent projects in Northridge (91324) and Woodland Hills (91364). That hands-on renovation and investment experience shapes every pricing conversation and days-on-market strategy at Parkway — sellers get a realistic read on what improvements actually return at resale, and buyers get an expert eye on a home's true condition and upside.
Parkway Estate Properties, Inc. · 15021 Ventura Blvd., Ste. 510, Sherman Oaks, CA 91403 · (818) 208-5881 · parkwayestate.com · Broker License #: 01873092 Equal Housing Opportunity. Information herein is general and not legal, tax, or financial advice. Consult qualified professionals for your specific situation.
Categories
Recent Posts











Broker | Realtor ® License ID: 01873092
+1(818) 208-5881 | info@parkwayestate.com