
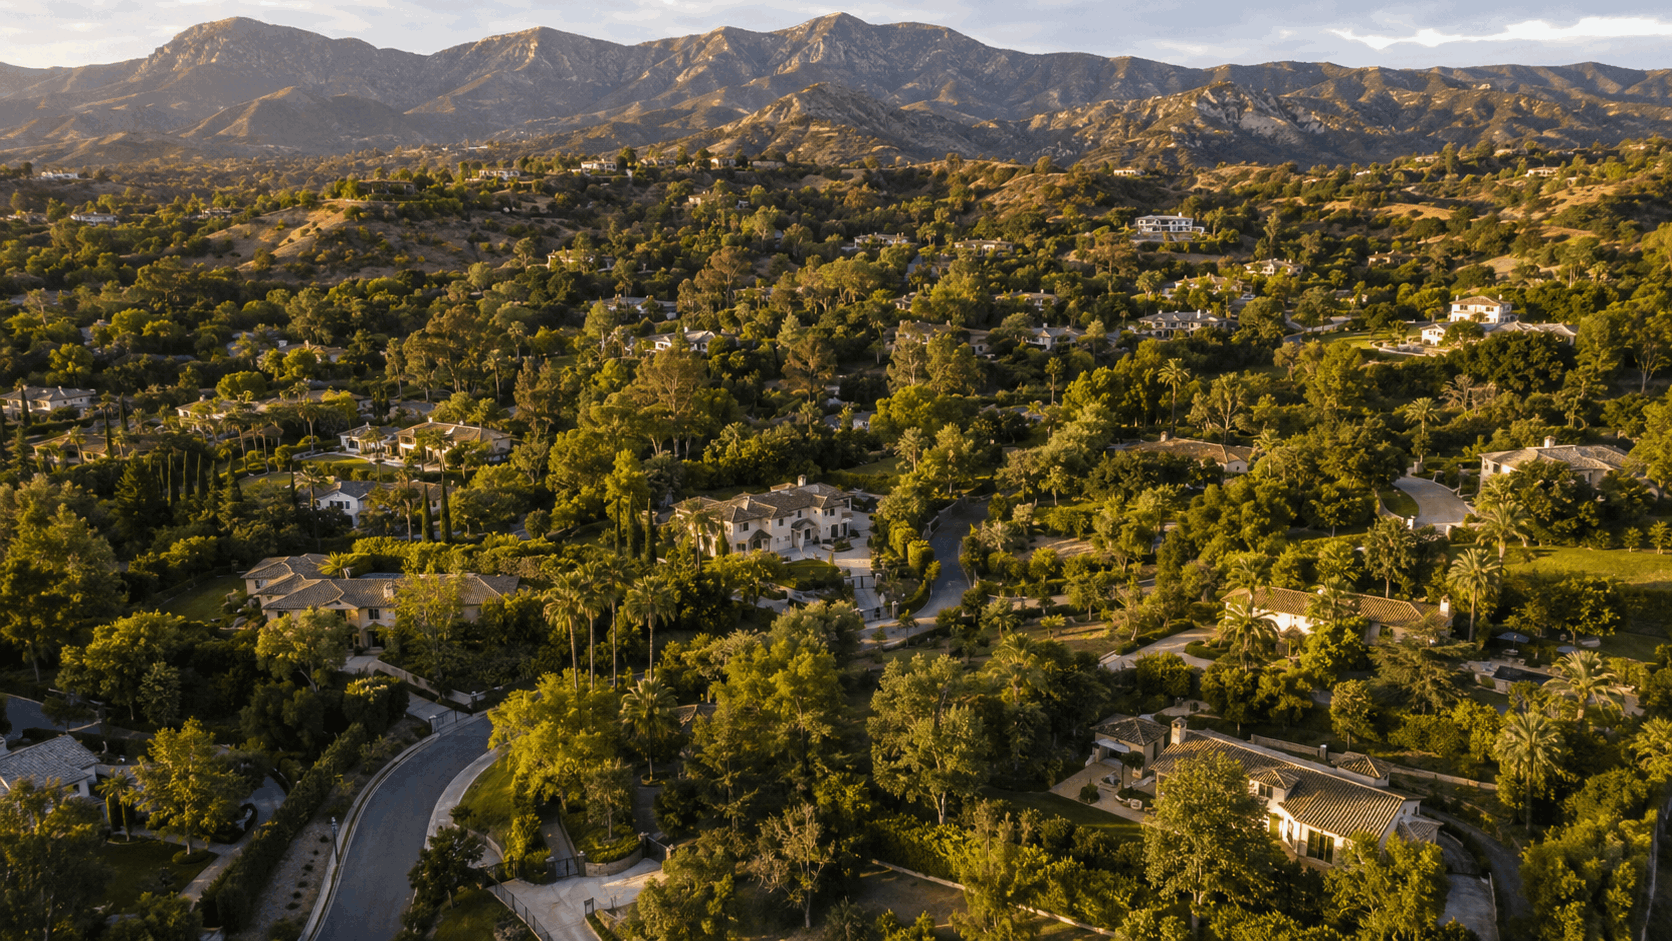
What Have Calabasas Home Prices Done in the Last 5 Years?

Calabasas home prices over the past five years have told a story that mirrors the broader Los Angeles market arc — pandemic surge, rate-shock correction, stubborn price floor, measured recovery — but with two Calabasas-specific characteristics that consistently distinguish its trajectory from the SFV markets to its east. First, the correction in Calabasas 91302 and 91372 was shallower than comparable markets because the school-quality and privacy demand drivers that define Calabasas buyer motivation don't evaporate when mortgage rates rise. Second, the recovery has been more uneven by price tier than in higher-volume SFV markets — with the $1.5M–$2.2M band recovering strongly and the $2.5M+ premium tier still carrying meaningful inventory and extended days on market that reflect a buyer pool that has thinned more than the sub-premium tiers.
Understanding the five-year arc — what drove each phase, what held the floor, and what the 2026 landscape actually looks like by sub-neighborhood and price tier — is the foundational market intelligence that every Calabasas buyer, seller, and long-term owner needs to make well-calibrated decisions.
1. 📈 2020–2022 — The Calabasas Surge and What Drove It
The pandemic era produced one of the most significant price surges in Calabasas 91302 and 91372 history — and understanding what specifically drove that surge in Calabasas, versus the broader LA market, explains why the correction that followed was shallower than most analysts predicted.
 The pandemic era's re-prioritization of privacy, space, and outdoor access — the three qualities Calabasas 91302 and 91372 deliver more completely than most comparable LA neighborhoods — drove a surge in Calabasas demand that produced 35–50% price appreciation across most sub-neighborhoods between 2020 and 2022.
Force 1 — The remote work re-prioritization:
The pandemic decoupled a meaningful share of high-income professional households from daily commute requirements — and when the commute calculus changed, Calabasas moved from "too far from work" to "exactly the right distance from everything." The privacy, the lot sizes, the quiet residential streets, the Malibu Creek morning hike — all of these qualities became dramatically more valued when the daily 405 or 101 commute was no longer the non-negotiable cost of enjoying them.
Remote workers who had been anchored in Santa Monica, Brentwood, and West Hollywood — paying Westside premiums for urban proximity they were no longer using — evaluated Calabasas and found that the same budget that bought a 1,600 sq ft Westside condo bought a 3,400 sq ft Calabasas home on a 14,000 sq ft lot with a pool. The migration was specific, motivated, and well-capitalized.
Force 2 — Historic low mortgage rates:
Rates at or below 3% from late 2020 through most of 2021 pulled forward years of latent Calabasas buyer demand into a compressed 18-month window. Buyers who had been pricing themselves out of Calabasas at 4–4.5% suddenly found their monthly payment calculus transformed. A $2.0M Calabasas home at 3.0% with 20% down produced a monthly P&I of approximately $6,750 — a payment that many dual-income professional households could support comfortably. The same home at 7.0% produces $10,660/month — a $3,910/month difference that priced a meaningful share of that buyer pool out of the $2.0M tier entirely.
Force 3 — The LVUSD school quality discovered by a new buyer cohort:
A specific dynamic that amplified Calabasas' surge relative to comparable markets: the pandemic forced a genuine school quality reckoning for parents who had been tolerating less-than-ideal school situations because they were too embedded in their prior neighborhoods to make the switch. The Las Virgenes Unified School District's reputation — already strong among informed SFV buyers — spread rapidly among Westside and mid-city parents evaluating school options during remote learning disruptions. LVUSD's academic outcomes, compared unfavorably for many Westside LAUSD schools during the pandemic period, drove a specific subset of family buyers to Calabasas who had not previously considered it.
The resulting price trajectory by sub-neighborhood:
- → 🏘️ Calabasas Country Club area (91302): Peak appreciation of 40–50% from Q4 2019 to Q2 2022. Homes that were trading at $1.4M–$1.6M in late 2019 were closing at $1.9M–$2.35M at peak.
- → 🏡 Las Virgenes Road corridor (91302): Peak appreciation of 35–45%. $950K–$1.1M homes in 2019 reaching $1.35M–$1.6M at peak.
- → 🏰 Gated communities (91372): Peak appreciation of 30–40% — slightly below the non-gated 91302 surge because the gated buyer pool, while affluent, was slightly less rate-sensitive and the HOA cost structure limited accessible buyer pool expansion.
2. 📉 2022–2023 — The Rate Shock and Why the Calabasas Floor Held
In mid-2022, the Federal Reserve began the most aggressive rate-hiking cycle in decades. Mortgage rates moved from near 3% to above 7% between spring 2022 and late 2022. The conventional prediction was a broad 15–25% housing price correction across the LA metropolitan area. In Calabasas, that prediction partially materialized — but the correction was shallower and more price-tier-specific than most analysts forecast.
What actually happened to Calabasas prices in 2022–2023:
- → 📉 Transaction volume: Collapsed significantly — down 30–40% year over year in Calabasas 91302/91372 from 2022 peak to 2023. The volume correction was the primary mechanism through which the rate shock manifested in Calabasas — sellers who didn't have to sell held, creating the inventory constraint that prevented the broader price decline.
- → 📉 Price correction in the $1.5M–$2.2M range: Approximately 7–12% off peak — less than comparable suburban LA markets at similar price points. A home that peaked at $2.1M in spring 2022 was transacting at $1.85M–$1.95M by Q3 2023.
- → 📉 Price correction in the $2.5M+ range: More significant — 12–18% off peak in most Calabasas 91302 premium sub-neighborhoods. A home that peaked at $3.2M was transacting at $2.65M–$2.8M by Q4 2023.
Why the Calabasas floor held more firmly than predicted:
The mechanism is specific and worth understanding:
- → 🏫 LVUSD demand does not evaporate with rate increases: The family buyer who needs to be in Las Virgenes Unified for their child's kindergarten enrollment in September does not wait for rate drops. School-calendar deadlines create a demand floor that is structurally different from the discretionary demand that collapses when rates rise.
- → 🔒 Golden handcuff inventory constraint: Calabasas homeowners who locked in 2.75–3.5% mortgages in 2020–2021 had no financial motivation to sell into a 7% rate environment. The sellers who did list were typically those with external life events driving the sale — relocation, estate settlement, divorce — not voluntary sellers responding to market conditions. This constrained the supply that would have driven a deeper correction.
- → 💰 Well-capitalized buyer base: Calabasas buyers are, on average, better capitalized than buyers in adjacent SFV markets. The cash buyers, high-down-payment buyers, and buyers with significant equity from prior sales who continued to transact through the rate shock maintained a demand floor that more rate-dependent markets couldn't sustain.
- → 🌿 Non-replicable amenity value: The Malibu Creek State Park access, the PCH proximity, the LVUSD quality, and the privacy of larger lots are not available in adjacent markets regardless of price. Buyers who specifically want these characteristics have no substitute — which creates a structural demand floor even in compressed market conditions.
3. 📊 2023–2024 — Stabilization and the Beginning of Recovery
By late 2023 and into 2024, Calabasas 91302 and 91372 had found their price floor and buyer engagement had begun to normalize. The stabilization and early recovery phases were driven by several converging factors.
 By 2023–2024, Calabasas 91302 and 91372 had found the price floor that the structural demand drivers — school quality, privacy, outdoor access — consistently produce. The stabilization period set the foundation for the measured recovery visible in 2024–2026.
What drove Calabasas stabilization:
- → 🔄 Buyer adaptation: By 2023–2024, qualified Calabasas buyers had adapted to the higher-rate environment — through seller-paid buydown structures that reduced effective monthly payments, adjustable-rate products that offered lower initial payments, and recalibrated budget ceilings that accepted higher rates as the new baseline.
- → 📉 Inventory remained historically low: The golden handcuff dynamic that began in 2022 intensified through 2023–2024. Owners with 3% mortgages on $2M+ Calabasas homes were not listing voluntarily — producing a supply constraint that prevented the price overhang that a more supply-heavy correction would have created.
- → 🏫 LVUSD demand restart: As the rate shock normalized, the family buyer pipeline into LVUSD re-engaged. The school quality that had driven the surge remained intact — enrollment results at Calabasas High School and the LVUSD elementary campuses continued to outperform comparable public school districts in the region — and parents who had paused their move-up or relocation decision in 2022–2023 re-activated in 2024.
- → 💰 Cash and equity-rich buyers: The buyers who could transact without rate sensitivity continued to be active throughout the correction and stabilization period — particularly in the $2.5M+ Calabasas tier where all-cash or near-cash buyers represented a higher share of transactions than in lower-price-band markets.
Price trajectory 2023–2024:
The $1.5M–$2.2M range in Calabasas 91302 recovered approximately 5–8% from its 2023 trough by the end of 2024 — bringing most sub-neighborhoods within 3–5% of 2022 peak levels. The $2.5M+ tier recovered more slowly — approximately 3–5% from trough — and remains more meaningfully below 2022 peak pricing as of 2026, reflecting the thinner buyer pool at premium price points.
4. 🏡 Where Calabasas Prices Stand in 2026 — By Sub-Neighborhood and Price Tier
The 2026 Calabasas price landscape reflects the full five-year arc — a surge, a moderate correction, a floor that held, and a recovery that is more complete in the volume-driven price tiers than in the premium tiers. Here is the current picture by sub-neighborhood and price band.
Calabasas Country Club area (91302) — 2026 snapshot:
- → 📊 Price range: $1.75M–$3M+ for 3,000–5,000+ sq ft homes on 12,000–25,000 sq ft lots
- → 📈 5-year change: Approximately 25–35% above 2019 pre-pandemic levels for renovated homes; approximately 15–22% above 2019 for original-condition homes
- → 📉 From 2022 peak: Renovated homes in this sub-neighborhood are within 3–8% of 2022 peak pricing; original-condition homes are 8–15% below peak
- → 🔄 Current dynamics: Active absorption in the $1.75M–$2.3M band with correctly priced listings; extended DOM in the $2.5M+ range; the renovation condition differential produces the largest spread between renovated and original-condition pricing of any Calabasas sub-neighborhood
Las Virgenes Road corridor (91302) — 2026 snapshot:
- → 📊 Price range: $1.4M–$1.95M for 2,500–3,800 sq ft homes on 9,000–16,000 sq ft lots
- → 📈 5-year change: Approximately 28–38% above 2019 for renovated homes
- → 📉 From 2022 peak: Within 2–5% of peak for well-renovated homes; 8–12% below peak for original-condition or partially updated homes
- → 🔄 Current dynamics: Most accessible Calabasas entry point with the most active buyer pool — move-up families from Woodland Hills 91364, West Hills 91307, and Tarzana 91356 represent the primary buyer profile
The Commons-adjacent streets (91302) — 2026 snapshot:
- → 📊 Price range: $1.5M–$2.1M depending on lot size and condition
- → 📈 5-year change: Comparable to the Las Virgenes corridor — 28–35% above 2019
- → 🔄 Current dynamics: Lifestyle convenience premium holds — the walkable proximity to Calabasas Commons adds a specific buyer appeal that insulates this sub-neighborhood from the broader market softening seen further from the neighborhood commercial center
Gated communities and 91372 — 2026 snapshot:
- → 📊 Price range: $1.6M–$6M+ depending on community, lot size, and home quality
- → 📈 5-year change: More moderate than non-gated 91302 — approximately 20–28% above 2019 for mid-tier gated community homes
- → 📉 From 2022 peak: The most significant below-peak pricing gap in the Calabasas market — 10–18% below 2022 peak in some 91372 communities, particularly at the $3M+ price points
- → 🔄 Current dynamics: Best buyer negotiating conditions in the Calabasas market; HOA fee sensitivity and insurance complexity create buyer hesitation that persistent sellers must price through
The Mulholland corridor and hillside properties (91302) — 2026 snapshot:
- → 📊 Price range: $2.0M–$5M+ for estate-scale properties
- → 🔄 Current dynamics: Extreme low transaction volume creates comp scarcity; prices are primarily determined by individual buyer-seller negotiation rather than robust comparable sales data; wildfire insurance complexity is most acute for the most mountain-interface addresses in this sub-neighborhood
5. 🔮 The 5-Year Forward Case — What Drives Calabasas Appreciation From Here
Understanding the five-year backward arc is useful for calibrating where values stand today. Understanding the structural case for the next five years is what makes the investment or lifestyle decision actionable.
 The structural demand drivers supporting Calabasas 91302 and 91372 appreciation — LVUSD school quality, Malibu Creek State Park access, genuine privacy, and constrained supply — have not changed through the five-year cycle, and remain the foundation for the forward equity case.
The structural case for continued Calabasas appreciation:
- → ✅ LVUSD school quality is not going anywhere: Las Virgenes Unified School District's academic performance is structural — it reflects community investment, administrative continuity, and a property tax base that supports school funding at levels most LA County districts cannot match. The demand driver that brought the remote-work migration wave to Calabasas in 2020–2022 remains fully intact. As long as LVUSD continues to outperform comparable public options in the region, school-motivated family buyers will continue to produce a demand floor in Calabasas regardless of rate cycles.
- → ✅ Malibu Creek and PCH access are permanent and non-replicable: The 10–15 minute proximity to Malibu Creek State Park and Pacific Coast Highway cannot be created anywhere else at any price. The outdoor access proposition that Calabasas delivers — a genuine wilderness experience plus Malibu beach access within 20 minutes of a residential address — is geographically fixed. As outdoor lifestyle values have become more central to residential decision-making post-2020, this fixed advantage becomes more rather than less valuable over time.
- → ✅ Supply is genuinely constrained: Calabasas is substantially built out — there are no large available parcels for significant residential development, the mountain interface limits expansion, and the political and environmental regulatory environment makes meaningful new supply addition effectively impossible. The homes that exist in Calabasas 91302 and 91372 are the homes that will be competing for buyers for the foreseeable future.
- → ✅ Relative value vs. the Westside persists: Calabasas continues to offer more home, more land, and more privacy per dollar than comparable Westside markets — with the Malibu/PCH access that partially bridges the coastal proximity gap. As Westside prices continue their long-term appreciation trajectory, the relative value of Calabasas will continue to attract buyers who have been priced out of the Westside but who are not willing to sacrifice lifestyle quality.
The risk factors to monitor:
- → ⚠️ Wildfire insurance availability and cost: The most significant structural risk unique to Calabasas — if insurance availability continues to deteriorate and cost continues to escalate, it creates a carrying cost headwind and transaction friction that could moderate appreciation in the most exposed sub-neighborhoods. This risk is real and deserves ongoing monitoring.
- → ⚠️ Premium tier ($2.5M+) buyer pool depth: The buyer pool for premium Calabasas properties above $2.5M has thinned more than the sub-premium tier — if rate relief materializes and re-activates this buyer pool, the premium tier has the most price recovery potential. If rates remain elevated and the premium buyer pool stays thin, the $2.5M+ tier remains the most challenging segment for sellers.
- → ⚠️ Remote work policy normalization: The remote work migration that contributed significantly to the 2020–2022 surge was partly driven by pandemic-era policies that have since moderated. A continued trend toward in-office requirements for LA's professional workforce increases commute friction for Calabasas residents and could moderate the remote-worker buyer segment that has been an active demand driver.
🚫 What NOT to Overdo
Don't use the 2022 peak as your pricing anchor in 2026. Calabasas sellers who price based on what comparable homes sold for at the 2022 peak — without adjusting for the correction and the current tier-specific recovery — are consistently overpricing and accumulating DOM that hands negotiating leverage to buyers. The correctly calibrated 2026 comp analysis uses closed sales from the last 90 days in your specific sub-neighborhood and price tier — not the highest sale your neighbor achieved at the market peak.
Don't confuse the $1.5M–$2.2M recovery with a full-market recovery. The price recovery visible in Calabasas 91302's most active transaction tier has led some sellers in the $2.5M+ range to assume the same recovery applies to their properties. It does not — the buyer pool dynamics, DOM expectations, and price-to-peak-pricing gap are meaningfully different above $2.5M. Premium-tier Calabasas sellers should calibrate their expectations against current premium-tier comps, not against the sub-premium recovery narrative.
Don't overlook the wildfire insurance issue in your five-year investment analysis. Any Calabasas buyer who is evaluating the neighborhood as a five-year or longer hold needs to include wildfire insurance cost trajectory in their analysis. If insurance costs continue to escalate at the pace of the past three years, the carrying cost of Calabasas ownership increases even as property values appreciate — compressing net investment returns in a way that the headline appreciation number doesn't reflect.
Don't apply SFV-wide market trends to Calabasas pricing decisions. Calabasas is not Northridge 91324. It is not Reseda 91335. It is not Canoga Park 91304. The price trajectory, buyer profile, school district quality, and structural demand drivers are specific to Calabasas in ways that make city-wide or county-wide market narratives consistently misleading when applied to 91302 and 91372. Every Calabasas pricing decision should be built from the ground up on Calabasas-specific comp data.
🏠 Real-World Scenario — Calabasas 91302 Five-Year Holder
A homeowner in Calabasas 91302 had purchased in late 2019 at $1.48M — a 3,100 sq ft renovated home on a 13,500 sq ft lot in the Las Virgenes Road corridor. They had financed at 3.75% with 20% down. When the surge began in 2020–2021, their home's estimated value climbed toward $1.95M by spring 2022. They considered selling at peak — and didn't, citing the uncertainty of finding replacement housing at elevated prices.
Through the 2022–2023 correction, their estimated value dipped to approximately $1.71M. The golden handcuff dynamic they were experiencing — a 3.75% mortgage they couldn't replicate at 7%+ — was itself keeping them from selling. By 2024, the estimated value had recovered to approximately $1.82M. In 2026, comparable renovated homes in the same sub-neighborhood are closing at $1.88M–$1.97M.
Their five-year outcome: a home purchased at $1.48M that is now worth approximately $1.9M — a 28% appreciation gain over five years. Monthly P&I on their 3.75% mortgage: approximately $5,500. Monthly P&I to replace the same home at current prices and current rates: approximately $10,400. They are staying — not just for the appreciation, but because the exit math produces a monthly carrying cost increase of approximately $4,900/month that makes voluntary relocation financially difficult regardless of appreciation.
🏠 Real-World Scenario — Calabasas 91302 2024 Buyer
A buyer couple engaged us in October 2024 — specifically targeting the Las Virgenes Road corridor in Calabasas 91302, targeting LVUSD enrollment for their two children for September 2025. Budget: $1.7M.
The Q3/Q4 2024 market conditions gave them more negotiating room than the spring 2022 conditions that had priced comparable buyers out of Calabasas. We identified a home in Calabasas 91302 that had been on market for 67 days — listed in August at $1.79M with two prior reductions to $1.69M. The extended DOM reflected an August launch timing mistake combined with a price that was above the current market rather than the correction-trough pricing it appeared to be.
We structured an offer at $1.61M with a seller-paid 2-1 buydown of $22,000 — reducing the buyers' year-one effective rate from 7.0% to 5.0% and lowering their monthly P&I from approximately $8,580 to approximately $6,913 in year one. The seller accepted at $1.63M with the $22,000 buydown contribution.
By Q2 2026, comparable homes in the same Calabasas 91302 sub-neighborhood are closing at $1.75M–$1.85M. The couple's estimated equity gain in 18 months: approximately $120,000–$200,000. Their children are enrolled in LVUSD. The October timing, the extended DOM targeting, and the buydown structuring combined to produce one of the strongest Calabasas buyer outcomes we've executed in the current market cycle.
❓ FAQ
Have Calabasas home prices recovered from the 2022–2023 correction? Partially and unevenly by price tier. The $1.5M–$2.2M range in Calabasas 91302 has largely recovered to or within 3–5% of 2022 peak pricing in most sub-neighborhoods. The $2.5M+ tier remains 8–15% below 2022 peak depending on specific sub-neighborhood and condition — the most significant recovery gap in the Calabasas market. Original-condition homes at any price point are typically 8–14% below their 2022 peak across all tiers.
How do Calabasas price trends compare to Woodland Hills 91364 over 5 years? Both Calabasas 91302 and Woodland Hills 91364 produced approximately 30–45% appreciation from 2019 to 2022 peak, and both experienced 6–12% corrections in 2022–2023. The key differences: Calabasas held its price floor more firmly through the correction because of the LVUSD school quality driver that doesn't have a direct Woodland Hills equivalent. Woodland Hills 91364 has recovered more completely in its premium sub-neighborhoods (Walnut Acres) because The Village and Topanga access maintain persistent Westside-relocator demand. Both markets show measured recovery in 2024–2026 with premium tier softness above $2.5M (Calabasas) and $1.8M (Woodland Hills).
What is driving Calabasas price appreciation in 2026? The primary drivers in 2026 are: ✓ LVUSD school quality maintaining family buyer demand regardless of rate environment. ✓ Constrained inventory from golden handcuff dynamics keeping supply below demand. ✓ Malibu Creek and PCH access attracting outdoor-lifestyle buyers who have no comparable alternative at the price point. ✓ Westside-relocator demand from buyers priced out of Santa Monica and Brentwood finding Calabasas value compelling. The primary headwinds are: ⚠️ Elevated mortgage rates compressing the qualified buyer pool at $2.0M+. ⚠️ Wildfire insurance cost and availability creating carrying cost uncertainty and transaction friction.
Is Calabasas a good real estate investment for a 5-year hold? The five-year investment case for Calabasas is defensible for buyers who enter at the right price tier and hold horizon. The structural demand drivers — school quality, outdoor access, constrained supply — are durable. The wildfire insurance cost trajectory is the primary risk variable that requires monitoring. Buyers who purchase at or below market value (using the extended DOM that currently exists in the $2.5M+ tier and the Q3 buyer leverage that consistently produces below-list outcomes) build the most resilient equity positions. Buyers who pay 2022 peak prices for premium-tier Calabasas homes in 2026 are accepting an upside-limited entry point.
What happened to Calabasas luxury home prices ($3M+) during the correction? The $3M+ Calabasas tier experienced the most significant correction in the 2022–2023 period — approximately 15–22% below 2022 peak in most comparable sales. This tier has recovered partially in 2024–2026 but remains 10–18% below peak in most Calabasas 91302 and 91372 premium sub-neighborhoods. Transaction volume at $3M+ has been low — which creates comp scarcity that makes pricing difficult for both buyers and sellers. For patient buyers targeting this tier, 2026 continues to offer the most buyer-favorable conditions seen since 2019.
How does the wildfire insurance issue affect Calabasas home values? The insurance situation is creating within-market differentiation rather than broad price declines. Properties with confirmed, affordable standard carrier coverage command a relative premium over comparable properties relying on FAIR Plan or specialty carrier coverage — a new form of value differential that didn't exist at this scale in 2020. The properties most affected by insurance-driven discount are the most mountain-interface addresses in the Mulholland corridor and the most exposed hillside properties of the Calabasas 91302 premium sub-neighborhoods.
What is the Calabasas price outlook for 2027–2028? Directional assessment — not a prediction: if rates moderate toward 5.5–6.5% in 2027–2028, the buyer pool expansion in the $1.8M–$2.5M Calabasas range could be significant — these buyers have been rate-constrained, not quality-constrained. Rate relief combined with continued LVUSD demand and constrained supply could produce another appreciation phase in the sub-premium Calabasas tiers. The premium $2.5M+ tier would likely benefit the most from rate relief given how much buyer pool expansion at that price point depends on financing affordability. Wildfire insurance trajectory is the risk variable that most directly affects these projections. All forward-looking assessments are directional only — consult qualified financial and real estate professionals for investment decisions.
🎯 Bottom Line
The Calabasas home price story over the past five years is not the dramatic collapse that rate-shock predictions anticipated, and it is not the uninterrupted appreciation that 2021–2022 peak enthusiasm implied. It is something more textured: a 35–50% surge driven by genuinely structural demand revaluation, a moderate 7–18% correction that held its floor because the school quality and outdoor access demand drivers don't disappear when rates rise, and a 2024–2026 recovery that is nearly complete in the $1.5M–$2.2M tier and still meaningfully incomplete in the $2.5M+ premium tier.
For sellers in 2026, the message is calibration by tier — not by peak nostalgia. For buyers in 2026, the message is entry point by condition and timing — the corrected premium tier and the Q3 buyer leverage window are the most favorable conditions for well-capitalized buyers who can take a patient approach. For long-term holders, the message is unchanged: the structural demand drivers that produced the Calabasas five-year price story — LVUSD quality, Malibu Creek access, constrained supply, genuine privacy — remain fully intact and continue to produce the demand floor that makes Calabasas one of the most defensible residential investment positions in the greater San Fernando Valley.
At Parkway Estate Properties, we track Calabasas 91302 and 91372 pricing alongside our core coverage of Woodland Hills 91364/91367, Sherman Oaks 91403/91423, Tarzana 91356, and Northridge 91324/91325. Every buyer and seller we work with in Calabasas gets a comp analysis that is sub-neighborhood specific, condition-tier adjusted, and grounded in the actual closed sales data rather than the broad market narratives that consistently misrepresent this specific market.
📩 Want to Know What the Five-Year Price Trends Mean for Your Specific Calabasas Home or Search?
We'll pull the sub-neighborhood comp analysis for your specific address and price point — and give you a clear picture of where values stand today relative to the five-year arc.
Contact Liana Shersher at Parkway Estate Properties: 📧 liana@parkwayestate.com · 📞 (818) 208-5881 · 🌐 parkwayestate.com 15021 Ventura Blvd., Ste. 510, Sherman Oaks, CA 91403
About the Authors
Liana Shersher Liana Shersher is a licensed real estate agent with Parkway Estate Properties Inc. and an Accredited Buyer's Representative (ABR) serving the San Fernando Valley — with a focus on Sherman Oaks, Encino, Tarzana, Woodland Hills, and Northridge (DRE# 02164224). Liana guides first-time homebuyers through every step of the purchase, from the first showing to the keys in hand, and represents move-up and repeat buyers across the Valley. For sellers, she builds the pricing and marketing strategy that positions a home to sell for top dollar, fast. Buyers and sellers work with Liana for clear communication, sharp local knowledge, and an agent who treats their goals like her own.
Roman Shersher Roman Shersher is the broker-owner of Parkway Estate Properties Inc. and a real estate investor with 18 years of experience in the San Fernando Valley (DRE# 01855095). Roman has personally led or co-led renovations on dozens of properties across the Valley, including recent projects in Northridge (91324) and Woodland Hills (91364). That hands-on renovation and investment experience shapes every pricing conversation and days-on-market strategy at Parkway — sellers get a realistic read on what improvements actually return at resale, and buyers get an expert eye on a home's true condition and upside.
Parkway Estate Properties, Inc. 15021 Ventura Blvd., Ste. 510, Sherman Oaks, CA 91403 · (818) 208-5881 · parkwayestate.com · Broker License #: 01873092 Equal Housing Opportunity. Information herein is general and not legal, tax, or financial advice. Consult qualified professionals for your specific situation.
Categories
Recent Posts


Broker | Realtor ® | License ID: 01873092
+1(818) 208-5881 | info@parkwayestate.com